


Warm Connection Pools in an LLM Gateway, and What They Do Not Fix
What a reused provider connection saves an LLM request, what it cannot save, and how to measure the gateway's share of your latency instead of trusting a headline number.
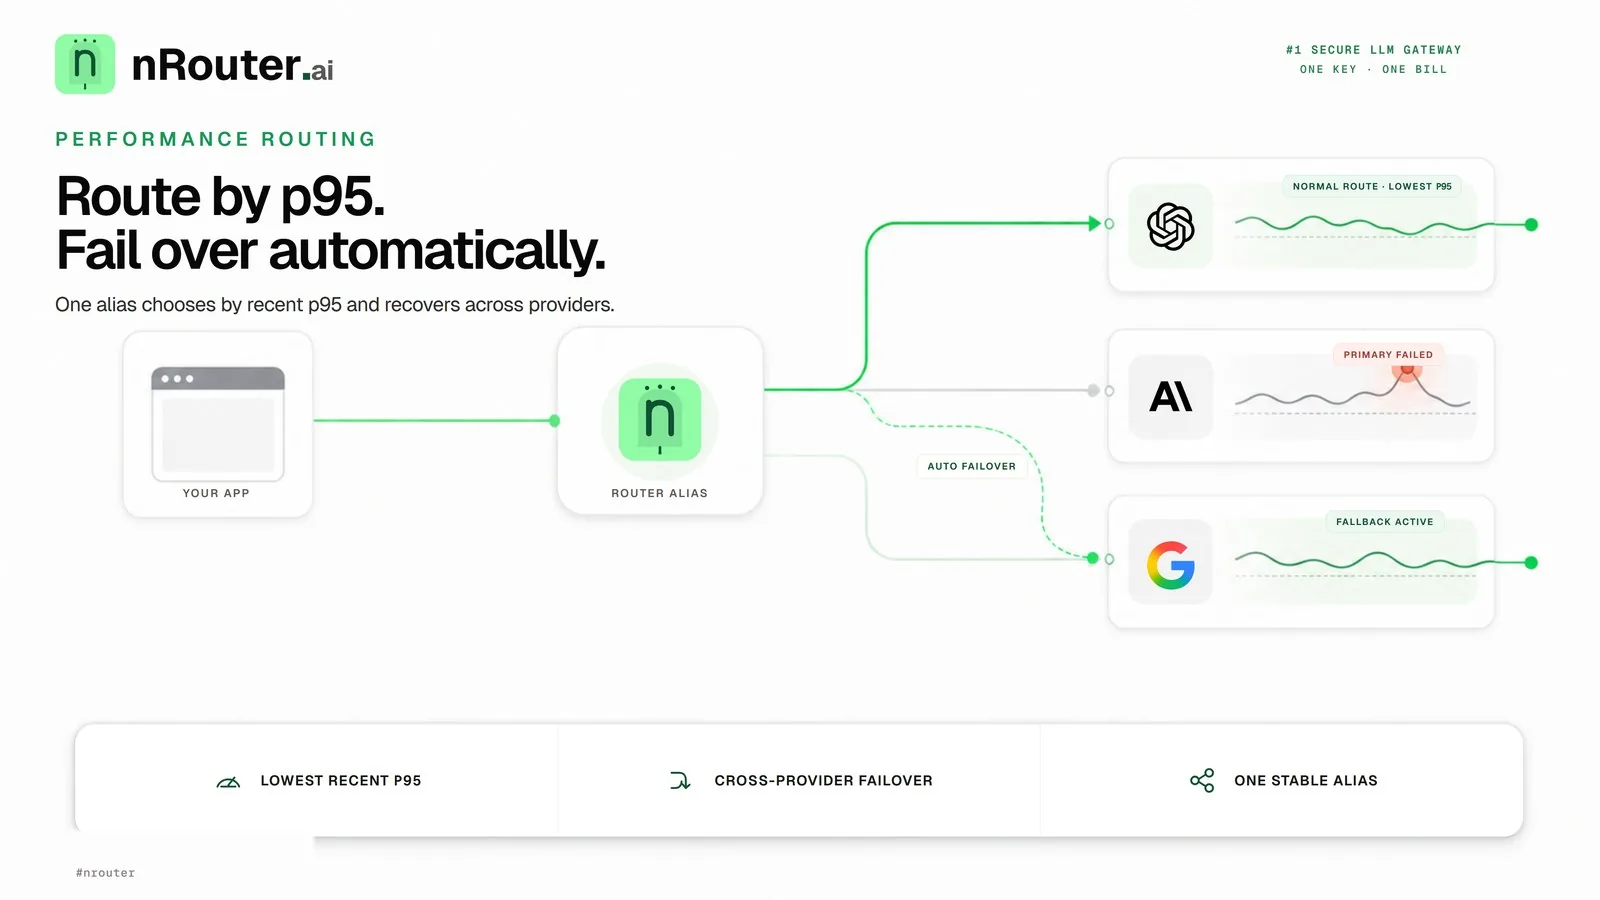
The short answer: a fresh HTTPS connection costs at least two network round trips — one for the TCP handshake and one for the TLS 1.3 handshake — before the first byte of a prompt is sent. A gateway that keeps provider connections open and reuses them removes that cost from every request after the first. It does not make the gateway's own work free: authenticating the key, rate limits, guardrails and the credit hold all take measurable time, which you can read back per request instead of taking anyone's word for it.
Correction, 2026-10-15
An earlier version of this post was titled "Sub-2ms LLM Gateway Routing with Warm HTTP/2 Pools" and published routing-overhead figures, concurrency benchmark tables and failover timings that we could not support with saved measurements. Those claims are removed. The URL is unchanged so existing links keep working. What remains is what the gateway actually does, and how to measure it yourself.
Adding an intermediary between your application and the model provider looks like a latency tax, and part of it is one. The useful question is not "is there overhead" but "which overhead, and how big, for my traffic". This post separates the cost a warm connection pool genuinely removes from the cost it cannot touch, then shows the numbers from one real production request so the split is concrete.
The problem in one request
Consider a serverless function that receives a user prompt, builds a new SDK client, and calls a model provider. Before the provider sees a single prompt token, the client does this:
Client (cold)                                   Provider edge
   │                                                 │
   ├── 1. DNS lookup for the provider host ─────────>│  (resolver round trip, unless cached)
   ├── 2. TCP handshake: SYN, SYN-ACK, ACK ─────────>│  1 round trip
   ├── 3. TLS 1.3 handshake ────────────────────────>│  1 round trip
   ├── 4. HTTP request headers + prompt body ───────>│  1+ round trips for a large body
   │                                                 │
   └── first byte of the answer comes back after the model starts generating
Steps 2 and 3 are fixed by the protocols: TCP needs a three-way handshake (RFC 9293), and a full TLS 1.3 handshake needs one more round trip before application data (RFC 8446). How many milliseconds that is depends entirely on the distance between your client and the provider: a client in the same region pays little, one on another continent pays a lot.
Step 4 has a second, quieter cost. A new TCP connection starts with a small congestion window — the standard initial window is ten segments (RFC 6928) — and grows it only as acknowledgements arrive (RFC 5681). A prompt carrying a large retrieved context can therefore need several round trips just to finish sending on a fresh connection, where a warmed one sends it at once.
If the next user turn builds another client, it pays the whole sequence again.
Why the naive approach breaks
The usual first fix is client-side keep-alive. It helps, and it stops helping in three predictable ways:
| Approach | What it fixes | Where it breaks |
|---|---|---|
| HTTP/1.1 keep-alive in each process | Sequential requests reuse one socket | One in-flight request per connection; concurrency means a new handshake per extra request |
| A pool per container, many containers | Each container stays warm | Traffic is spread across instances, so each pool's sockets sit idle and the provider closes them; the next request finds a dead socket |
| Short-lived functions | Nothing persists | Every cold start rebuilds the client and pays the full handshake sequence |
The first row is the structural one. An HTTP/1.1 connection carries one request at a time (RFC 9112); a streamed completion holds it for as long as tokens keep coming. Twenty concurrent chats need twenty connections, and a twenty-first request either waits or opens a new one. HTTP/2 interleaves many streams on one connection (RFC 9113), up to the concurrency limit the server advertises, which is why it matters for streaming workloads.
Client-side pools also cannot coordinate anything across processes: two containers cannot know they are jointly about to exceed a rate limit or a budget until the provider, or the invoice, tells them.
The mechanism
nRouter sends every provider call through one shared, long-lived HTTP client per gateway instance rather than a client per request. In customer terms, that means:
- Connections are reused. After a provider connection is opened, it stays in the pool and later requests to the same provider reuse it, skipping the TCP and TLS handshakes. Where the provider negotiates HTTP/2, concurrent requests share connections as multiplexed streams, and the flow-control window adapts to the link.
- The pool is bounded. The number of idle connections kept per provider host is capped, and idle connections are retired after a timeout, so a burst cannot leave the gateway holding an unbounded pile of sockets it needs for everything else.
- Dead connections are detected. TCP keepalive probes catch a connection that a NAT or load balancer dropped without telling anyone, so a request does not pick up a socket that will never answer. Small writes are sent immediately rather than batched.
- Every wait has a deadline. Connecting and reading from a provider are both bounded, so a provider that accepts a connection and then says nothing cannot hold a request, or its credit hold, indefinitely.
Before the provider call, the gateway runs its checks in a fixed order. They are real work against shared state, not free:
Your app ──> nRouter gateway ───────────────────────────────────────> Provider
              │ key_auth            authenticate the virtual key
              │ prompt_apply        apply your organization's prompt template
              │ rate_limit          your RPM and TPM windows
              │ guardrails_scoring  pre-call content inspection
              │ concurrency_permit  your concurrency slot
              │ auto_decision       only for nrouter/auto: choose the model
              │ reserve             the credit hold for this request
              │ compression         prompt compression decision
              │ provider ──────────────── reused connection ────────────>│
              │ attempt_record      record the provider attempt
              │ post_call           post-call guardrails on the response
The step names are the ones each request's trace records. Tokens are relayed to you as they arrive, subject to the post-call guardrail chain, and the cost is settled after the response finishes — the accounting behind that is in Reserve-and-Settle: Never Overspend a Credit Balance.
Worked example
Here is one real production request, measured on 2026-10-15: a single nrouter/auto chat
completion with the response cache off, read back with its own key through the per-step
trace. It is one request, not a benchmark, and not a promise about yours.
| Phase | Steps | Time (ms) |
|---|---|---|
| Before the provider call | key_auth 30.6 · prompt_apply 110.1 · rate_limit 49.3 · guardrails_scoring 93.3 · concurrency_permit 170.8 · auto_decision 369.7 · reserve 86.1 · compression 36.9 · untraced gaps 40.6 + 65.1 · steps under 0.1 ms | ≈ 1,053 |
| Provider call | provider | 4,465 |
| After the provider call | attempt_record 71.5 · post_call 41.9 · response_read 0.07 | ≈ 113 |
| Arrival to written record | 5,631 |
The arithmetic: 1,053 + 4,465 + 113 ≈ 5,631 ms. Three things follow from it.
- The provider was most of the wait — about 79% of this request. Connection reuse shortens the time to reach the provider; it does nothing about generation time.
- The gateway's own work was about a second here, not microseconds. The biggest
single step was
auto_decision, which runs only when you asknrouter/autoto choose the model; a request that names a model directly skips it. - Two gaps totalling about 106 ms belong to no declared step. A trace that shows its own gaps is more useful than one that quietly folds them into a neighbour, and those gaps are where we look next.
To measure your own share, compare the gateway's figure with your client's wall clock on a buffered call:
import time
from nroutersdk import nRouter

with nRouter() as client:                       # reads NROUTER_API_KEY
    t0 = time.perf_counter()
    client.nrouter.chat(
        messages=[{"role": "user", "content": "One sentence on TCP slow start."}],
        model="nrouter/auto", cache=False, max_tokens=64,
    )
    wall_ms = (time.perf_counter() - t0) * 1000
    meta = client.last_response
    print("request id      ", meta.request_id)
    print("served by       ", meta.model, "| routing", meta.routing, "| attempts", meta.attempts)
    print("gateway (ms)    ", meta.latency_ms, "  arrival to response headers")
    print("client wall (ms)", round(wall_ms, 1))
    if meta.latency_ms is not None:
        print("outside gateway ", round(wall_ms - meta.latency_ms, 1), "ms: your network and client")
For the per-step breakdown, TTFT on streams, and percentiles over many runs, follow Measure TTFT and Trace an LLM Request Step by Step in Python.
Edge cases we had to decide
1. When a provider accepts the connection and then says nothing, we stop waiting, because a silent socket would otherwise hold your credit hold forever. Connect and read deadlines bound every provider call. A request that fails before the provider answered releases its hold; you are not charged for it.
2. When a provider answers with a redirect, we refuse it rather than follow it, because following it would send the provider credential to whatever host the redirect named. A model API has no legitimate reason to redirect a request, so a redirect is treated as the failed upstream response it is.
3. When a provider has not sent its first byte within the attempt limit on a text endpoint and another candidate can serve the request, we move to that candidate inside the same credit hold, because a stalled provider should cost you neither money nor the whole request deadline. You are charged only for the candidate that answers. A lone or last candidate is never cut at that limit — there is nothing better to move to.
4. When a burst opens many connections to one provider, we keep only a bounded number idle afterwards, because an unbounded idle pool exhausts the sockets the gateway needs to settle or release holds it already took. Extra connections are closed once the burst passes.
5. When the answering model is not the primary, we tell you, because a latency number
from a fallback is a different measurement. x-nr-routing reads fallback:<n> and
x-nr-attempts counts the provider calls, so you can separate those samples. The
behaviour of the chain itself is in
Provider Fallback Chains: Surviving an OpenAI Outage.
What you see from the outside
Every response carries x-nr-* headers, and every request leaves a record you can read
back with the same key:
HTTP/1.1 200 OK
x-nr-request-id: <id>
x-nr-model: <model that answered>
x-nr-routing: direct
x-nr-attempts: 1
x-nr-latency-ms: <integer ms, arrival to response headers>
x-nr-cost-status: exact
x-nr-request-cost: <USD>| Header | Meaning |
|---|---|
x-nr-request-id | The id that joins this response to its record and its trace |
x-nr-model | The model that actually answered |
x-nr-routing | direct, or fallback:<n> when a later chain entry answered |
x-nr-attempts | How many provider calls this request made |
x-nr-latency-ms | Gateway time from arrival to response headers ready; on a stream, that is before the first token, so it is not TTFT |
x-nr-cost-status / x-nr-request-cost | exact with the USD cost, or unpriced with the cost header absent — never a zero |
The record adds what headers cannot carry: the settled cost of a streamed request, the server-side first-token time, and the per-step trace used in the worked example. Reading that record is walked through in What an LLM Request Log Should Contain — and What to Leave Out.
Limits
- Distance is not negotiable. A reused connection removes handshakes, not the round trip itself. If your application and the provider are far apart, every request still pays that distance; placing compute near the provider matters more than any pool.
- Generation time belongs to the model. In the worked example the provider was most of the wait. Choosing a faster model for the task is the lever there — compare candidates on models.
- HTTP/2 over TCP still shares one loss domain. When a packet is lost, every stream on that connection waits for the retransmission; that head-of-line effect is the problem QUIC was designed around (RFC 9000).
- The first request to a provider is still cold. Pools warm on use. A gateway instance that has not yet talked to a provider pays the handshakes once.
- The gateway's checks have a cost. Authentication, rate limits, guardrails and the credit hold protect your budget and your data, and they take measurable time. Measure them for your traffic; latency figures for percentiles are explained in LLM Latency: p50, p95, p99, and Time-to-First-Token.
Try it
- Create a key at app.nrouter.ai/signup. Pay as you go starts from a $5 credit purchase, 0% platform fee; a purchase charges exactly the credits bought.
- Measure your own split with the script in Measure TTFT and Trace an LLM Request Step by Step in Python.
- Talk to us about placement. If distance dominates your latency, review nRouter deployment options for dedicated capacity.
See also
- Measure TTFT and Trace an LLM Request Step by Step in Python — the script that produces the per-step numbers used in this post, for your own requests.
- LLM Latency: p50, p95, p99, and Time-to-First-Token — how to read the tail once you have more than one sample.
- How to Benchmark an LLM Gateway in Production: Cost, Latency, Reliability, and Quality — how to turn measurements into a benchmark you can defend.
- Provider Fallback Chains: Surviving an OpenAI Outage — what happens to a request when the first provider cannot serve it.
- Reserve-and-Settle: Never Overspend a Credit Balance — what the
reservestep does and why a failed call costs nothing. - RPM and TPM Rate Limiting Per Key, Team, and Org — the windows the
rate_limitstep checks. - Pricing — pay as you go, 0% platform fee, usage at the served model's exact list price.
Sources
Verified 2026-10-15; if any specification has drifted, email hello@nrouter.ai.
- TCP (RFC 9293): datatracker.ietf.org/doc/html/rfc9293
- TLS 1.3 (RFC 8446): datatracker.ietf.org/doc/html/rfc8446
- TCP initial window (RFC 6928): datatracker.ietf.org/doc/html/rfc6928
- TCP congestion control (RFC 5681): datatracker.ietf.org/doc/html/rfc5681
- HTTP/1.1 (RFC 9112): datatracker.ietf.org/doc/html/rfc9112
- HTTP/2 (RFC 9113): datatracker.ietf.org/doc/html/rfc9113
- QUIC (RFC 9000): datatracker.ietf.org/doc/html/rfc9000
- OpenAI production best practices: platform.openai.com/docs/guides/production-best-practices
- Anthropic API overview: docs.anthropic.com/en/api/overview
- Production timings in the worked example: one
nrouter/autorequest measured on 2026-10-15 and read back through its per-step trace; a single example, not a benchmark.
Frequently asked questions
Does routing through an LLM gateway add latency compared to calling a provider directly?
It adds the time of the gateway's own work: authenticating your key, checking rate limits, inspecting content, taking a credit hold and recording the request. It can also remove connection setup you would otherwise pay on a cold client, because the gateway reuses provider connections. Which effect is larger depends on your client and your workload, so measure it: every request's record carries a per-step trace you can read back.
How is HTTP/2 multiplexing different from HTTP/1.1 keep-alive?
Keep-alive lets one TCP connection carry many requests, but an HTTP/1.1 connection carries one request at a time, so concurrent requests need concurrent connections. HTTP/2 interleaves many streams on one connection, up to the limit the server advertises, so concurrency no longer means a new handshake per request.
What happens when a provider stops answering on a pooled connection?
Connect and read deadlines bound the wait, and the credit hold is released when the request fails before the provider answered. When a provider has not sent its first byte within the attempt limit and another candidate is available, the gateway moves to that candidate under the same hold and you are charged only for the model that answers.
Is the gateway's work done entirely in memory?
No. Several checks read or write shared state, such as your rate-limit windows and your credit hold, so they cost real milliseconds. The per-step trace shows exactly how many, for each request.
Senior SEO engineer at nRouter, focused on search, AEO, and content performance.
More from Engineering
All posts →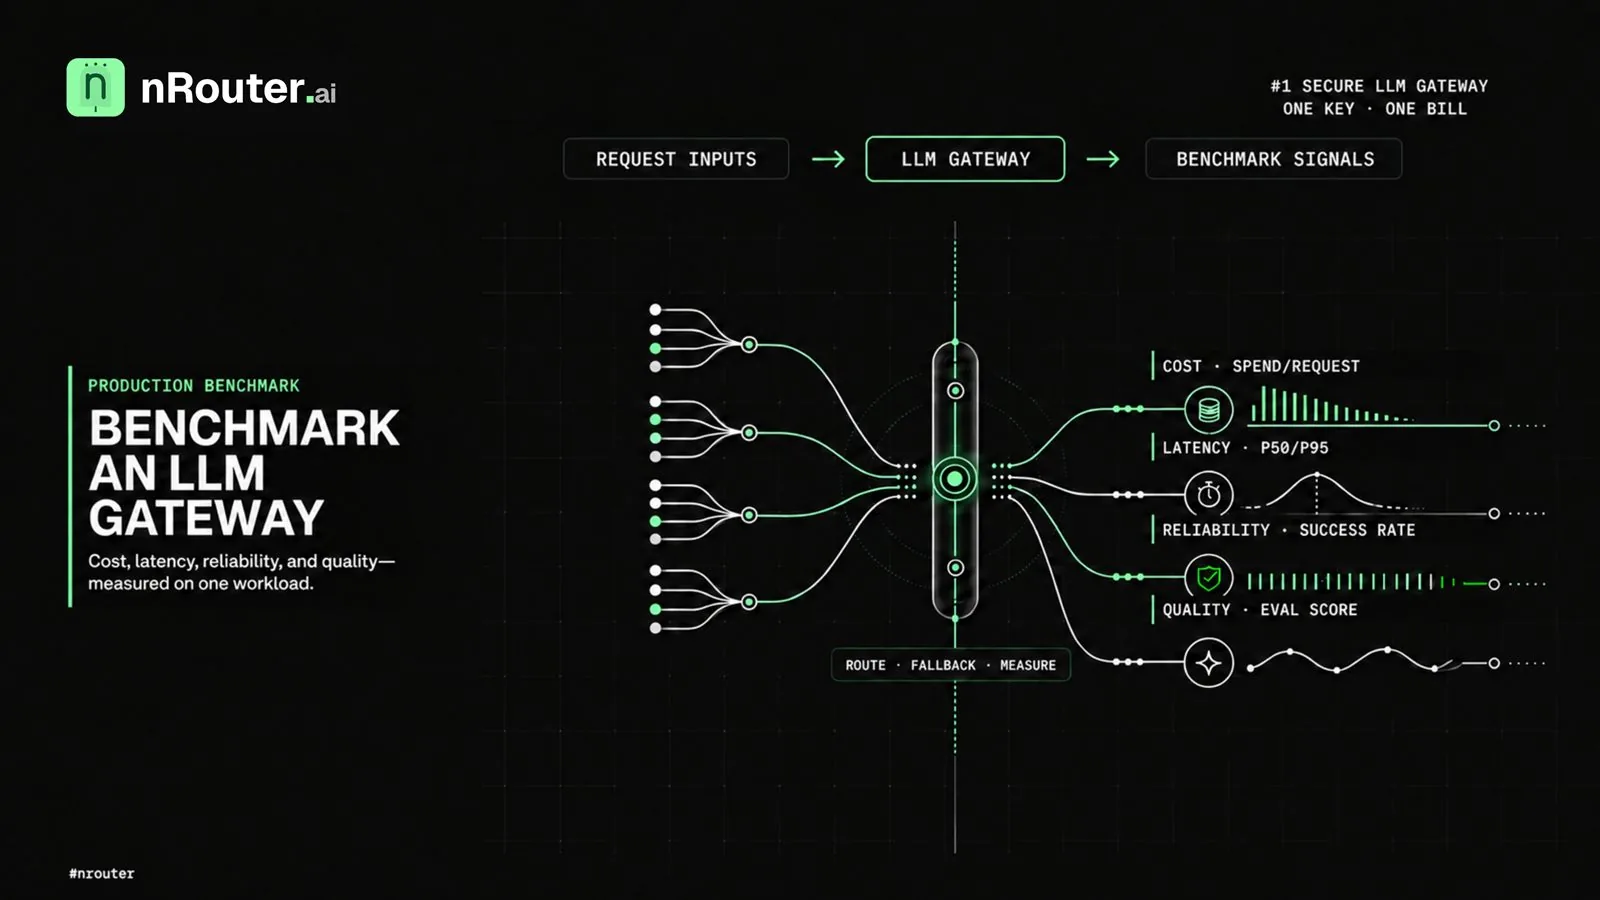
How to Benchmark an LLM Gateway in Production: Cost, Latency, Reliability, and Quality
Follow a repeatable LLM gateway benchmark methodology for cost, latency, reliability, failover, and output quality before publishing measured results.
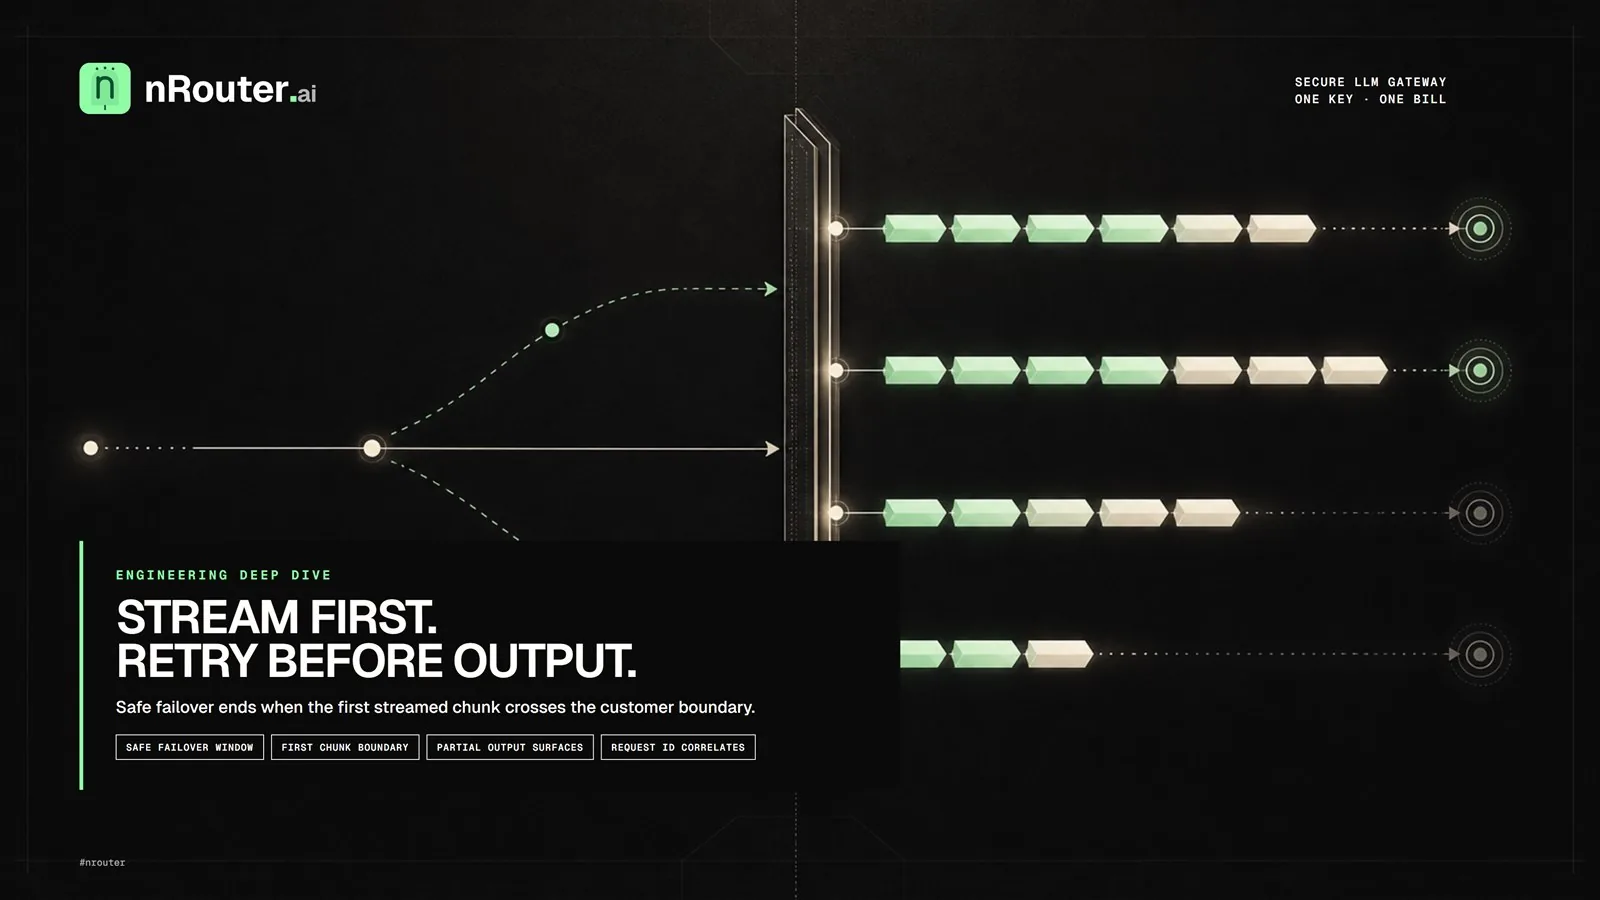
LLM Streaming Failures: Why Mid-Stream Retry Duplicates Output
Understand where LLM streaming failover stops being safe, why partial output cannot be replayed silently, and how clients recover without duplicated text.
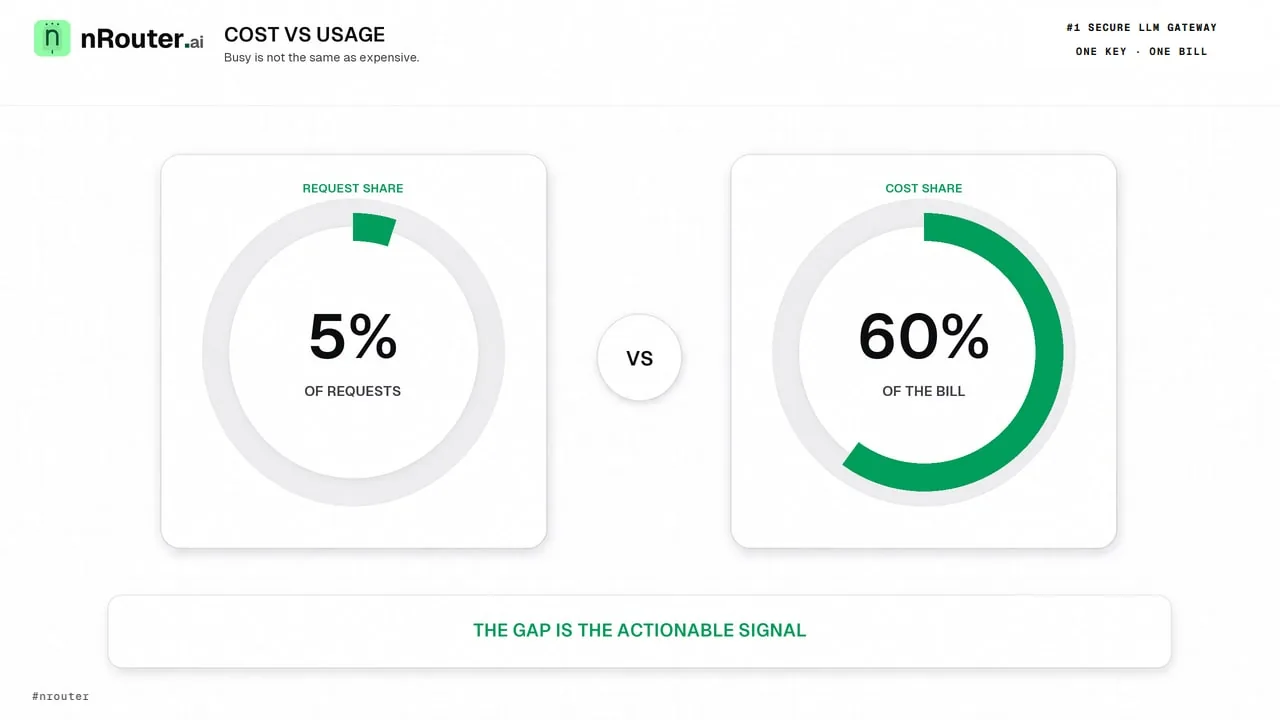
5% of Requests, 60% of the Bill: Reading Cost Against Usage
Request count and dollar cost tell different stories, and the gap between them is where the savings are. Here are the four shapes an overlay of cost and usage produces, which one to chase first, and what makes the numbers trustworthy enough to act on.