


LLM Logs in Datadog and Langfuse: What Works Today
nRouter does not deliver request logs to Datadog or Langfuse yet. Here is what works today: response headers, request tags, CSV export and alert channels.
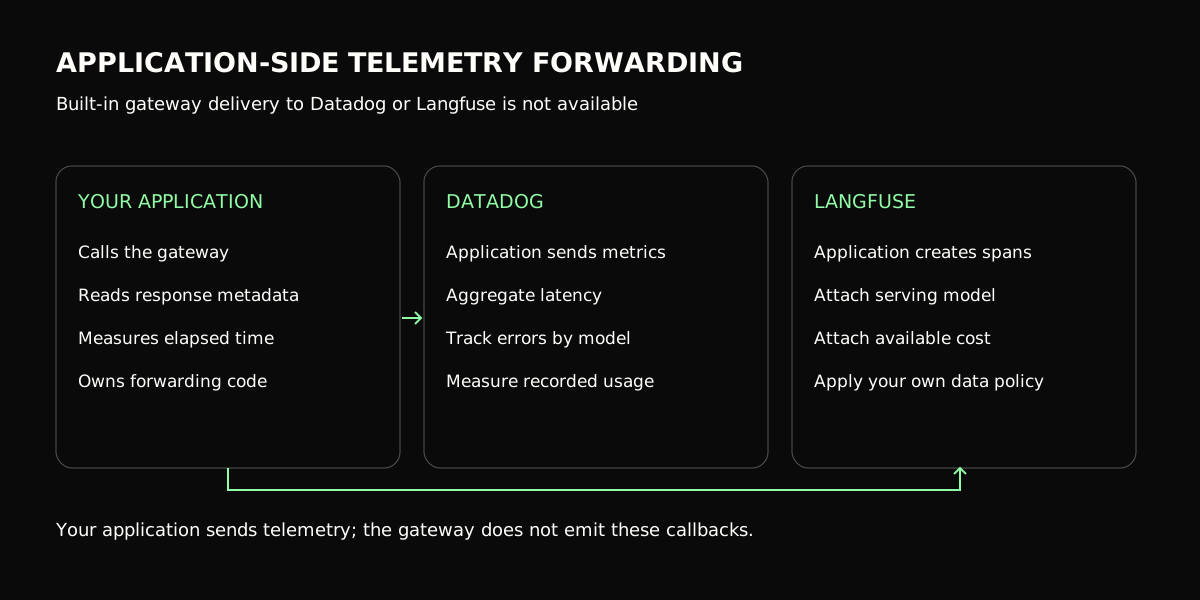
Figure 1: Application-side telemetry forwarding — response metadata can feed Datadog metrics and Langfuse traces.
The short answer: nRouter does not deliver request logs to Datadog, Langfuse, Amazon S3, Google Cloud Storage, Slack or a webhook yet. What works today: every response carries
x-nr-*headers that your own code can send to any tool, requests can be tagged with thex-nr-tagsheader, the Logs page exports CSV, and a Slack or webhook destination can be saved and tested.
This article is about getting LLM logs into Datadog or Langfuse when the gateway does not send them for you. The current state of each destination is in Observability & Logs.
Correction, 2026-10-07: an earlier version of this guide described log destinations as a feature you could configure and verify for Datadog, Langfuse, S3 and others. That overstated it. No request log is delivered to any external tool today, and Test connection works for Slack and webhook destinations only. The guide below has been rewritten to what is true now.
Nobody wants a second place to look. If AI traffic lives in a dashboard that only one person opens, it is not observability, it is a tab. The usual answer is to have the gateway send its logs to the tools you already run. nRouter does not do that yet, so this guide takes the other route: your application already receives everything it needs on each response, and your application can do the sending.
That route has one real advantage. It is your code, so it works today, with whatever tool you use, and nothing about it depends on a feature that has not shipped.
Datadog, Langfuse, Slack, Amazon S3 and Google Cloud Storage are trademarks of their respective owners. nRouter is not affiliated with or endorsed by them. Vendor claims below are sourced from their own documentation, linked in
## Sources.
When you need this
Your incident review has a hole shaped like AI. Latency and error rate for every other service are on one dashboard, and the model calls are somewhere else. You want p95 for a model call next to p95 for the API that wraps it, on the same screen, with the same alerting.
Prompt analytics and cost analytics disagree. The prompt tooling knows which template ran and the billing view knows what it cost, and nothing joins them. The join key exists. It is the request id, and it only helps if you carry it into both systems on purpose.
Compliance asked for an archive. Someone needs "all AI requests for the quarter" in durable storage. Request logs are kept for a limited window that depends on your plan, so the archive is something you build from the CSV export, on a schedule you own.
What you need first
- A virtual key, created on the Keys page. You never paste a model-provider API key anywhere in nRouter, because nRouter holds the provider credentials itself (why we don't do BYOK).
- Credentials for the tool you send to. A Datadog API key, or your Langfuse keys and host. These stay in your application's environment. For the approach in Step 2 they are never entered into nRouter.
- Traffic to look at. Every request through the gateway is logged automatically, with no SDK change, header or flag. If you have made calls, the Logs page already has them.
- Owner or admin permission, only if you want to save a Slack or webhook destination or create alert channels. Members can view that configuration but not change it.
- A decision about content. Prompt and response text are never stored in the request log. Read Step 6 before you decide what your own code sends anywhere else.
Step 1 — Know what is delivered today, and what is not
Start from the facts, because a runbook built on a feature that is not live fails during the incident it was written for.
| Path | Works today? | Notes |
|---|---|---|
| Built-in delivery of request logs to Datadog, Langfuse, S3 or Google Cloud Storage | No | Not available yet |
| Built-in delivery of request logs to Slack or a webhook | No | A destination can be saved and tested; no request logs are sent to it |
| Test connection on a saved destination | Slack and webhook only | Sends one test message |
Response headers on every call (x-nr-request-id, cost, model, tokens) | Yes | Your code reads them and sends them wherever you like |
Request tags through the x-nr-tags header | Yes | Used for cost attribution |
| Logs page and CSV export | Yes | The way to get request logs out |
| Alert channels (Email, Slack, Microsoft Teams, Jira, webhook) | Yes | Notifications when an alert fires; a different thing from request logs |
There is no real-time feed of request logs and nothing fires per request to a third party. If a plan of yours assumes traces are arriving in Langfuse or metrics in Datadog from the gateway, change the plan, not the dashboard.
It still helps to know what each tool is for before you write the sending code. Langfuse structures
everything as observations nested inside traces grouped into sessions, with user_id,
session_id, tags and metadata carried at trace level
(concepts). That shape is built for "which
step of which conversation went wrong". Datadog's Log Management is the opposite shape: a
high-volume intake you query and alert on, submitted through its
Logs API. The same row is worth different amounts in
each, which is a good reason not to send everything everywhere.
Step 2 — Send the response headers from your own code
Every response from the gateway carries headers that describe the call:
x-nr-request-id— the id of the request, present on every response.x-nr-request-cost— the cost of the call. It is absent when the call could not be priced. It is never0as a placeholder.x-nr-cost-status—exactorunpriced. This is what tells an absent cost from a free one.x-nr-model— the model that served the request.x-nr-input-tokens,x-nr-output-tokens,x-nr-total-tokens— token counts, when usage is available.x-nr-latency-ms— milliseconds until the response headers were ready.
Read them where you make the call and write one structured record. This example sends that record to Datadog's log intake. The Datadog host depends on your Datadog site, so check their Logs API page for yours.
const res = await fetch("https://api.nrouter.ai/v1/chat/completions", {
  method: "POST",
  headers: {
    Authorization: `Bearer ${process.env.NROUTER_API_KEY}`,
    "Content-Type": "application/json",
    "x-nr-tags": "team=support,feature=thread-summary,env=prod",
  },
  body: JSON.stringify({
    model: "gpt-5.4-mini",
    messages: [{ role: "user", content: "Summarize this support thread in two lines." }],
  }),
});

const h = res.headers;
const record = {
  message: "llm.request",
  service: "support-assistant",
  ddsource: "nrouter",
  http_status: res.status,
  nr_request_id: h.get("x-nr-request-id"),
  nr_model: h.get("x-nr-model"),
  nr_cost_status: h.get("x-nr-cost-status"),
  // Absent when unpriced. Keep it null; never turn it into 0.
  nr_request_cost: h.get("x-nr-request-cost"),
  nr_input_tokens: h.get("x-nr-input-tokens"),
  nr_output_tokens: h.get("x-nr-output-tokens"),
  nr_total_tokens: h.get("x-nr-total-tokens"),
  nr_latency_ms: h.get("x-nr-latency-ms"),
};

// Your code sends this, with your Datadog key, from your environment.
await fetch("https://http-intake.logs.datadoghq.com/api/v2/logs", {
  method: "POST",
  headers: {
    "DD-API-KEY": process.env.DD_API_KEY ?? "",
    "Content-Type": "application/json",
  },
  body: JSON.stringify([record]),
});
For Langfuse the idea is the same. You already create a trace or an observation around the model
call with the Langfuse SDK; put the same fields in its metadata, and put the request id there
first. Then a trace in Langfuse and a row on the nRouter Logs page can be matched by one value.
Three practical notes:
- Do the sending off the request path. Queue the record or write it to your normal application log and let your existing log shipper carry it. A slow observability vendor should never slow a user-facing call.
- Log the request id even if you log nothing else. It is the join key between your application logs, the gateway's log row and the CSV export. It is also the first thing support asks for.
- Decide what content goes with it. The headers carry no prompt text. If you add the prompt to your own record, that is your decision and your retention policy. Step 6 covers it.
If you already emit OpenTelemetry from your services, name these fields to match rather than
inventing a parallel vocabulary. OpenTelemetry's registry defines a gen_ai.* attribute namespace
(GenAI attributes), and
the conventions now live in the dedicated
GenAI semantic conventions repository.
That is the place to check what is stable before you standardise on a name. This is about the spans
your own services emit; nRouter does not export traces to your collector.
Step 3 — Tag requests so the numbers can be grouped
Telemetry with no dimensions is a number you cannot act on. Send the x-nr-tags request header with
comma-separated key=value pairs, as in the example above:
curl -sS -D - -o /dev/null https://api.nrouter.ai/v1/chat/completions \
  -H "Authorization: Bearer $NROUTER_API_KEY" \
  -H "Content-Type: application/json" \
  -H "x-nr-tags: team=support,feature=thread-summary,env=prod" \
  -d '{
    "model": "gpt-5.4-mini",
    "messages": [{"role": "user", "content": "Summarize this support thread in two lines."}]
  }' | grep -iE '^x-nr-(request-id|request-cost|cost-status|model)'
The tags are used for cost attribution inside nRouter. Send the same values in the record your code writes in Step 2, and both systems group the same way.
Keep cardinality sane: tag the groupings you will report on, never a unique id per request. And remember that tags describe spend; they never authorize it. Which team's budget a call draws from comes from the authenticated key, not from a header. That separation is the point of attributing spend by team, customer, and feature, and the per-key scoping half is virtual keys vs the master key.
Step 4 — Export request logs as CSV
The Logs page lists every request with model and provider, token counts and total cost, latency and status, cache-hit status, start and end timestamps, and a request id. Search by request id to jump to a call, filter by model, status and time range, then export the current view to CSV.
That export is how request logs leave nRouter today. Two things follow from it:
- Retention is by plan. Request logs are kept 7 days on pay as you go (14 days on grandfathered Pro and 30 days on Max). Older rows are deleted. If you need a quarter of history, export on a schedule that is shorter than your window and store the files yourself.
- The CSV is a fine warehouse input. Load it into the system where your other cost data lives and join on the request id your application logged in Step 2.
The Advanced Analytics reports cover the grouped view. /advanced-analytics/cost, /advanced-analytics/usage,
/advanced-analytics/cost-vs-usage, /advanced-analytics/keys, /advanced-analytics/agents and /advanced-analytics/api-consumers each
carry the same filter bar, with CSV export on most of them for admins and owners. If the question is
"which model got quietly expensive", that is
cost vs usage.
Step 5 — Use alert channels, and save a Slack or webhook destination
These are two different things, and it is worth keeping them apart.
Alert channels deliver today. Create channels under Observability → Alerts → Channels (Email,
Slack, Microsoft Teams, Jira, or a webhook), then enable alerts on /alerts and bind them. Budget
threshold crossings dispatch a JSON envelope to a webhook with title, message, severity and a
details object; when you configure a secret, the payload is signed with HMAC-SHA256 and carries
the signature header:
import crypto from "node:crypto";

// Verify an nRouter webhook before trusting it.
export function verifyNrouterSignature(rawBody: string, header: string, secret: string): boolean {
  if (!header?.startsWith("sha256=")) return false;
  const expected = crypto.createHmac("sha256", secret).update(rawBody).digest("hex");
  const provided = header.slice("sha256=".length);
  const a = Buffer.from(expected, "hex");
  const b = Buffer.from(provided, "hex");
  // timingSafeEqual throws on unequal lengths, so a malformed signature is refused first.
  return a.length === b.length && crypto.timingSafeEqual(a, b);
}
Verify before you trust: without a secret, anyone who learns the URL can replay a payload at you.
The full envelope and a Python verifier are in the webhooks documentation. An
alert is a notification about a threshold. It is not a copy of your request logs.
A log destination can be saved, and that is all. Under Log Settings → Callbacks an owner or admin can save a destination. For a Slack or webhook destination, Test connection sends one test message, so you can confirm the URL is right.
Saving a destination does not send your logs
No request log is delivered to a saved destination today, for any destination type. A passing Test connection proves the Slack or webhook URL accepts a message. It does not prove request logs will arrive, because none are sent. Do not build a runbook on it.
Step 6 — Decide what must never leave
When your own code sends records to a vendor, that vendor is another place your data lives, under its retention policy. Datadog states the mechanism plainly: "indexed logs are deleted from the Datadog platform once their retention period, as defined by you, expires" (Log Management data security). The clock on a row you send is one you set over there.
That clock is a legal object as well as an operational one. GDPR Article 5 requires personal data to be "adequate, relevant and limited to what is necessary" and "kept in a form which permits identification of data subjects for no longer than is necessary" (Art. 5 GDPR). Prompt text is routinely personal data, so if your code adds it to a record, the destination inherits both duties.
Know precisely what nRouter itself keeps. Request metadata (model, tokens, cost, latency) is always stored, because it is the billing record; no setting turns that off. Prompt and response text are never stored in the request log. The headers in Step 2 carry metadata only, so a record built from headers alone contains no prompt text.
The judgement calls about what belongs in a log at all are in what to log (and not log) on an LLM gateway, and the technique for keeping logs useful after redaction is in redacting PII from LLM logs.
Verifying it worked
Your record arrives with a request id. Make one call, then find the record in Datadog or
Langfuse and confirm it carries nr_request_id. This proves your own sending path, which is the
only delivery path there is today.
The same id finds the row in nRouter. Search that request id on the Logs page. Model, tokens and cost on the row should match the header values your code recorded.
The CSV has the columns you expected. Export a filtered view and confirm it carries model, tokens, cost, latency, status and request id. If a downstream job is going to depend on those columns, the time to find out is now.
A bound alert actually arrives. Create a throwaway budget with a low Max Spend, a soft threshold at 50%, and your Slack or webhook channel bound to it, then send enough traffic to cross the threshold. Delete the budget afterward.
Alerts never blocked anything. Confirm your traffic was unaffected while the alert fired. Alerts are notification-only by design; the hard stop lives in budget controls, never in the observability path.
What goes wrong
Expecting traces in Langfuse from the gateway. Symptom: a destination is saved and nothing arrives. That is the current state of the product, not a misconfiguration. Fix: send from your own code as in Step 2, and use the CSV export.
Reading a passing Test connection as delivery. Symptom: the Slack test message arrived, and request logs never do. The test sends one message and nothing else is sent. Fix: treat it as a URL check only.
Turning an absent cost into zero. Symptom: a dashboard shows free calls. x-nr-request-cost is
absent when a call is unpriced. Fix: store null, and record x-nr-cost-status beside it.
Losing history past the retention window. Symptom: last month's rows are gone on a 7-day or 14-day plan. Fix: export CSV on a schedule shorter than your window.
An alert with no channel bound. Symptom: an alert is enabled and nobody is notified. Fix: create the channel under Observability → Alerts → Channels first, then bind it.
A member trying to save a destination. Symptom: the configuration is visible but not editable. Destinations and channels are admin/owner actions by design. Fix: ask an admin.
Citing a control that does not exist. Symptom: an audit answer that cites log streaming to a SIEM, or a "zero logging" mode. Neither exists. Fix: base the answer on what is true today: prompt and response text are not stored, request metadata always is, and retention is 7, 14 or 30 days by plan. That is also the framing in the SOC 2 checklist for LLM gateways.
Try it
Observability, guardrails, evals, A/B tests, prompt management and per-team budgets are on every plan. nRouter sells one plan, pay as you go, with a 0% platform fee; a credit purchase charges exactly the credits bought ($5 costs $5.00, $100 costs $100.00) and nRouter absorbs card-processing costs. Usage settles at the served model's exact list price (0% markup). No subscription plan is sold (existing subscribers keep theirs). The pricing table is at /pricing.
Load the $5 minimum — charging exactly $5.00 — make a handful of tagged calls, and open the Logs page. You will have a request-by-request view with cost and latency before you have configured anything at all.
→ Start at app.nrouter.ai/signup, then log x-nr-request-id from your first response.
Want built-in delivery to a specific tool? Say so in the nRouter community. Until it exists, the response headers and the CSV export are the way out.
See also
- What to Log (and Not Log) on an LLM Gateway — the policy decision that should come before you send records anywhere.
- Write-Time PII Redaction in LLM Logs, Without Losing Debug Detail — how to keep a redacted log useful during an incident.
- Attribute LLM Spend by Team, Customer, and Feature — the tags from Step 3, and how far they should and should not be trusted.
- LLM Latency: p50, p95, p99, and Time-to-First-Token — which latency number to alert on once the records are in your dashboard.
- Cost vs Usage: Finding the Quietly Expensive Model — the report that answers the "why did the bill move" question today.
- A SOC 2 Checklist for LLM Gateways — how log retention and redaction fit an audit, stated as what is true now.
- Pricing — pay-as-you-go terms and 0% platform fee; observability is not a paid add-on.
Sources
nRouter product statements corrected 2026-10-10; vendor documentation last checked 2026-08-23. Corrections to hello@nrouter.ai.
- Log destinations, Test connection, retention and what is not delivered yet: Observability & Logs
- Alert catalog, channels and delivery: Alerts & Notifications
- Webhook envelope and HMAC-SHA256 signature verification: Webhooks
- Reports, group-by dimensions and CSV export: Analytics & Reports
- What is stored, and privacy controls: Organization Settings
Vendors, cited for their own behaviour
- Datadog log intake: Logs API · retention and deletion of indexed logs: Log Management data security
- Langfuse's observation / trace / session model and trace-level
user_id,session_id,tags: Concepts · docs
Standards
gen_ai.*attribute names, and where the conventions are now maintained: OpenTelemetry GenAI attributes · semantic-conventions-genai- Data minimisation and storage limitation: Art. 5 GDPR
Frequently asked questions
Does nRouter deliver request logs to Datadog or Langfuse?
Not yet. Request logs are not delivered to any external tool today. You can view them on the Logs page and export them as CSV.
How do I get LLM cost and latency into Datadog or Langfuse today?
Send it from your own code. Every response carries x-nr-request-id, x-nr-request-cost, x-nr-cost-status, x-nr-model and token headers, and your application can write those to any tool it already uses.
What does Test connection do?
It sends one test message to a saved Slack or webhook destination. It works for those two destination types only, and it does not mean request logs will arrive, because none are sent yet.
How long are request logs kept?
7 days on pay as you go (grandfathered subscriptions keep 14 days on Pro and 30 days on Max). Export the CSV for anything you need to keep longer.
Support engineer at nRouter, writing routing and performance guides from real customer workloads.
More from Guides
All posts →
Measure TTFT and Trace an LLM Request Step by Step in Python
Send an nrouter/auto request with the Python SDK, read routing, guardrails and cost from its headers, fetch the request back by id, print every gateway step with its start, end and duration, then measure TTFT and latency over N runs.
 nRouter Team
Ship Your First AI Feature: Signup to Production in an Afternoon
A step-by-step path from a funded nRouter account to a production LLM call with a spend ceiling on it — create a scoped key, point your existing OpenAI client at one base URL, cap the key, and verify the cost header came back.
Latency Routing and Automatic Failover Without Retry Code
Measure candidate model latency, configure explicit fallbacks, understand the gateway attempt budget, and verify the result on your own p95.