


Observability & Logs
Gain full observability into LLM traffic with nRouter. Inspect request logs, analyze latency, read response telemetry headers, and export logs to CSV.
Every request through nRouter is logged with granular execution metadata, per-step latency tracing, and exact cost settlement. The Logs page provides your request-by-request operational view, and Log Settings is where you configure trace detail and manage log destinations. Delivery of request logs to an external tool is not available yet; CSV export from the dashboard is how you extract logs today.
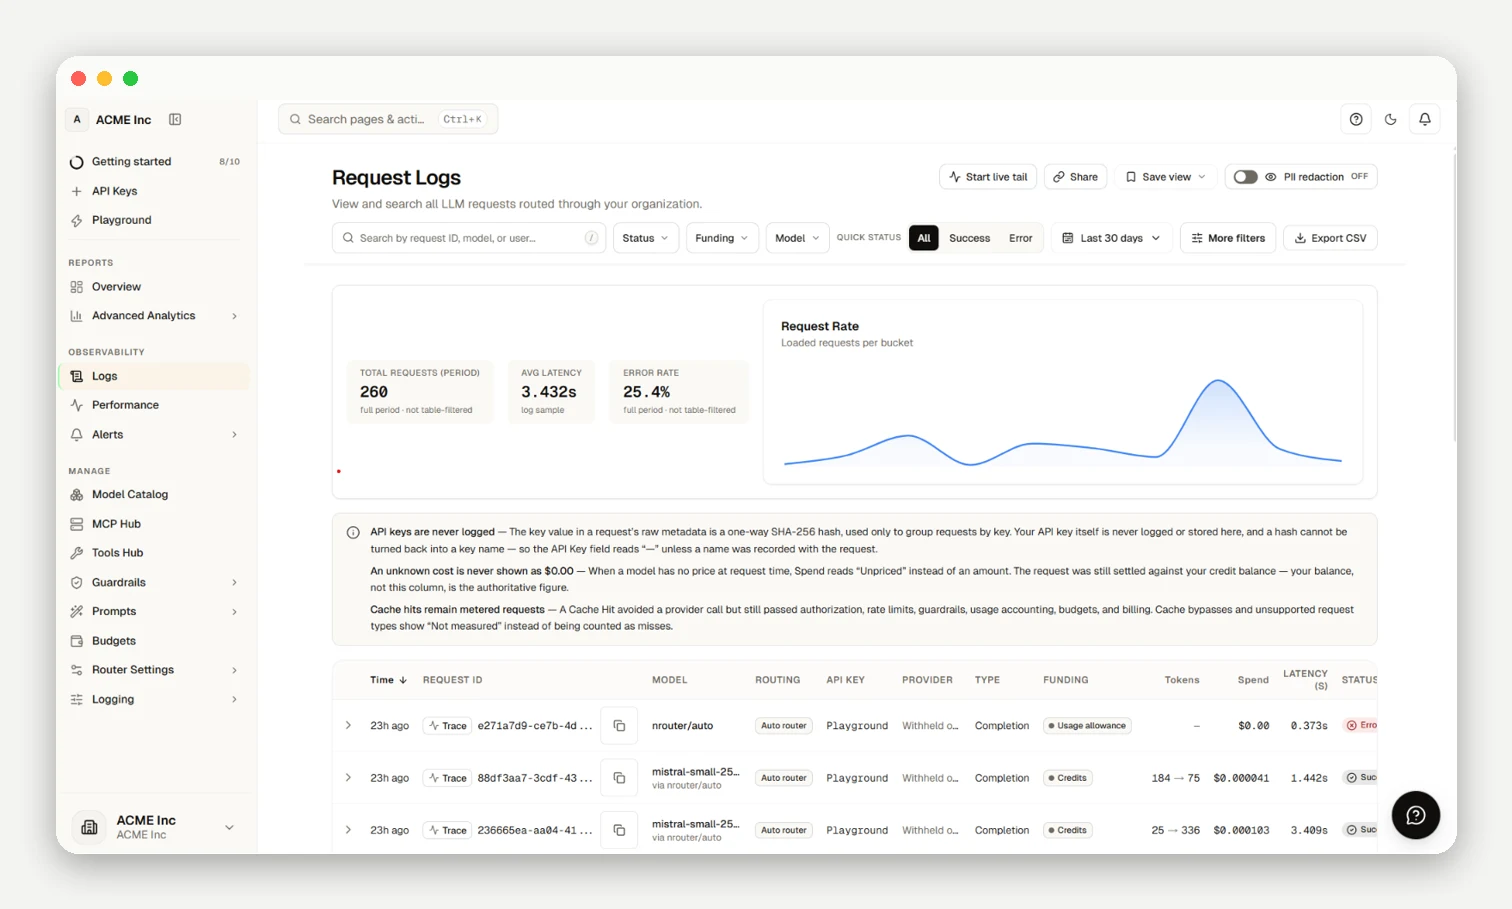
Request Logs & Tracing
The Logs page (/logs) lists requests with model, provider, tokens, exact cost, latency, cache status, and timestamps. Search by request ID or export to CSV. Prompt and completion text never enters the log.
- Tracing: Gateway traces record microsecond offsets relative to edge arrival (
T0) and terminal states (ok,refused,error,timeout,cancelled). - Trace Levels: Configured in Log Settings (
trace_level:off,stages,verbose). Lower per-request detail withx-nr-traceandx-nr-trace-stages.
Logging callbacks
Under Log Settings → Callbacks you can save an external log destination. Each stores settings for success, failure, or both, but saving a destination does not deliver anything today.
When external log delivery becomes available it will be at-least-once: retried rows can arrive a second time, so a destination that does not de-duplicate can receive the same row twice.
Data policy & Serving Cache
Request metadata is always stored as the authoritative billing record. Request/response content is never written to the log: the log carries identity, shape, outcome, and cost; no prompt or completion text enters it. Full Logging (capturing content for debugging) is coming soon. Configure privacy and masking under Privacy Settings.
Separately, a short-lived serving cache stores non-streaming responses for repeat queries (opt out via nrouter_cache: false). See Response Caching.
Response Headers
Every individual response carries telemetry in the x-nr-* namespace:
| Header | Value | Emitted |
|---|---|---|
x-nr-request-id | Unique request UUID | Always — search logs or cite in support |
x-nr-latency-ms | Milliseconds from edge arrival to headers | Always |
x-nr-model | Physical model that served the request | On success |
x-nr-request-cost | Exact cost in USD | When priced; absent when unpriced |
x-nr-cost-status | exact or unpriced | Every served response |
x-nr-input-tokens / x-nr-output-tokens / x-nr-total-tokens | Provider token counts | When available |
x-nr-routing | direct, or fallback:<n> | When provider answered; absent on cache hits |
x-nr-attempts | Provider calls attempted (≥ 1) | When provider answered; absent on cache hits |
x-nr-response-cache | hit, miss, or bypass | Cache-eligible requests |
x-nr-guardrails | none, monitor, pass, redacted, partial, blocked, unavailable | Pre-call guardrail chain |
x-nr-limit-source | Ceiling that fired (key, budget, etc.) | On 429 and 402 responses |
See Response Headers for the complete reference. Route notifications via Observability → Alerts → Channels (see Alerts & Notifications).
Next steps
Frequently asked questions
Can I look up a single request or export my logs?
Yes, search by request ID to jump to a call or download filtered records using CSV export.
Who can change the logging level and data policy?
Changing logging levels or data policies requires Owner or Org Admin privileges; members have read-only access under Privacy Settings.
If I reduce logging or redact PII, will my spend numbers still be accurate?
Yes, request metadata is always stored for billing and x-nr-request-cost headers pass through regardless of policy.
Which external tools can I stream my logs to?
None yet; external log delivery is not active today, so use dashboard CSV export to extract records.
How is PII protected in my logs, and where do I control it?
Logs apply client-side pattern masking and optional server-side redaction configured in Privacy Settings.
What telemetry comes back on the response itself, without the dashboard?
Responses return x-nr-* headers with latency, model ID, token counts, exact cost, routing chains, and guardrail posture (see Response Headers).
Why is a header I expected missing from a response?
Absence indicates the event did not occur; for example, unpriced models omit x-nr-request-cost rather than reporting zero.
What's the difference between a logging callback and an alert channel?
Logging callbacks store streaming destinations for request logs (coming soon), while alert channels route event notifications to tools like Slack or Email.
Who can set up logging callbacks and alert channels?
Only Owners and Org Admins can create or configure callbacks and alert channels.
Is my prompt or completion content stored anywhere?
Prompt and completion content is never written to the log; short-lived serving cache entries expire automatically or can be bypassed with nrouter_cache: false.