


Alerts & Notifications
Configure real-time alerts for error spikes, high latency, provider outages, budget limit alerts, hanging requests, and automated daily usage summaries.
nRouter delivers automated real-time alerts that continuously evaluate API spend thresholds, error rates, latency anomalies, hanging requests, and upstream provider outages across configured notification channels. Background evaluation jobs run every 5 to 10 minutes, dispatching alerts to bound channels without consuming credits or counting against throughput rate limits. Configure all rules on the Alerts page (/alerts).
Alert Types & Cadence
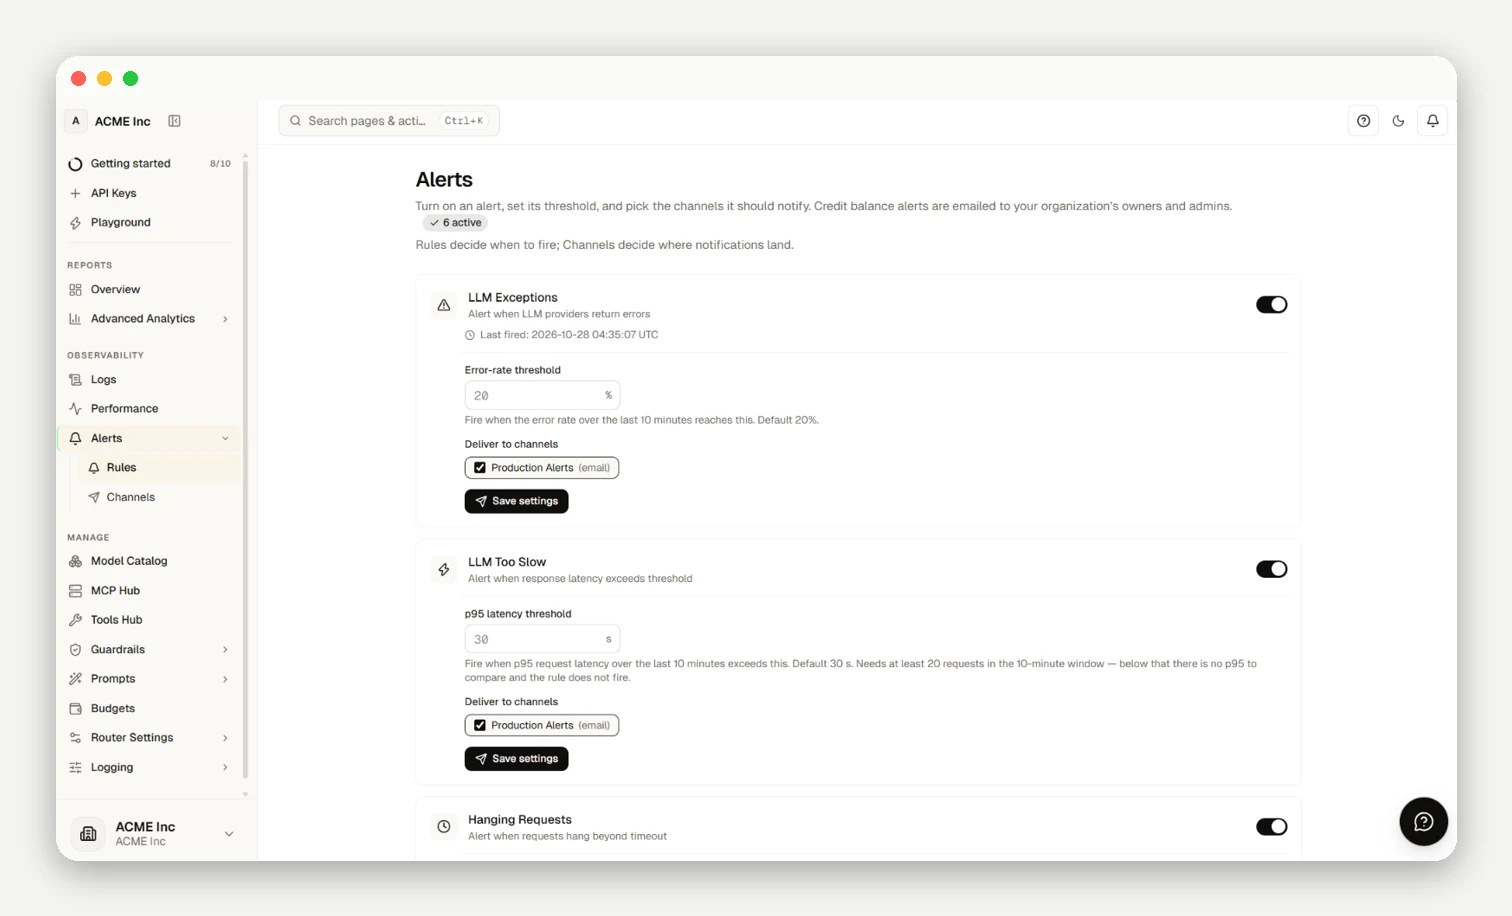
| Alert | Condition | Cadence | Status |
|---|---|---|---|
| Budget Alerts | Spend reaches configured percentage of a budget | Every 10 min | Live |
| Daily Reports | Daily spend & token usage summary digest | Every 5 min | Live |
| Hanging Requests | Individual request duration exceeds threshold (60-min lookback) | Every 5 min | Live |
| LLM Too Slow | Rolling 10-minute p95 latency exceeds threshold (≥ 20 requests) | Every 5 min | Live |
| LLM Exceptions | Rolling 10-minute error rate exceeds threshold (≥ 20 requests) | Every 5 min | Live |
| Outage Alerts | Provider fails at or above threshold (≥ 20 requests) | Every 5 min | Live |
| Region Outage | Regional provider endpoint fails at or above threshold | Not evaluated | Preview (Not monitored yet) |
Note on Region Outage: Configurations are preserved, but regional endpoints are not evaluated by background workers yet.
Evaluation Gates
- Channel Binding: Telemetry alerts dispatch only to bound channels (Email, Slack, Microsoft Teams, Jira, Webhook). Budget Alerts & Daily Reports automatically route to Owners and Org Admins.
- Sample Floor: Aggregate alerts require at least 20 measurable requests in the rolling 10-minute window.
- Settle Margins: Requests in the last 30 seconds are held back to allow in-flight settlement.
- Cooldowns: 15-minute cooldown for telemetry alerts; 24-hour cooldown for budget alerts.
Low-traffic environments (fewer than 20 requests in 10 minutes) will produce no aggregate alert verdict. To catch latency issues in low-volume pipelines, use Hanging Requests, which evaluates each request individually with no sample floor. For low-volume error monitoring, review Analytics & Reports.
Delivery Channels
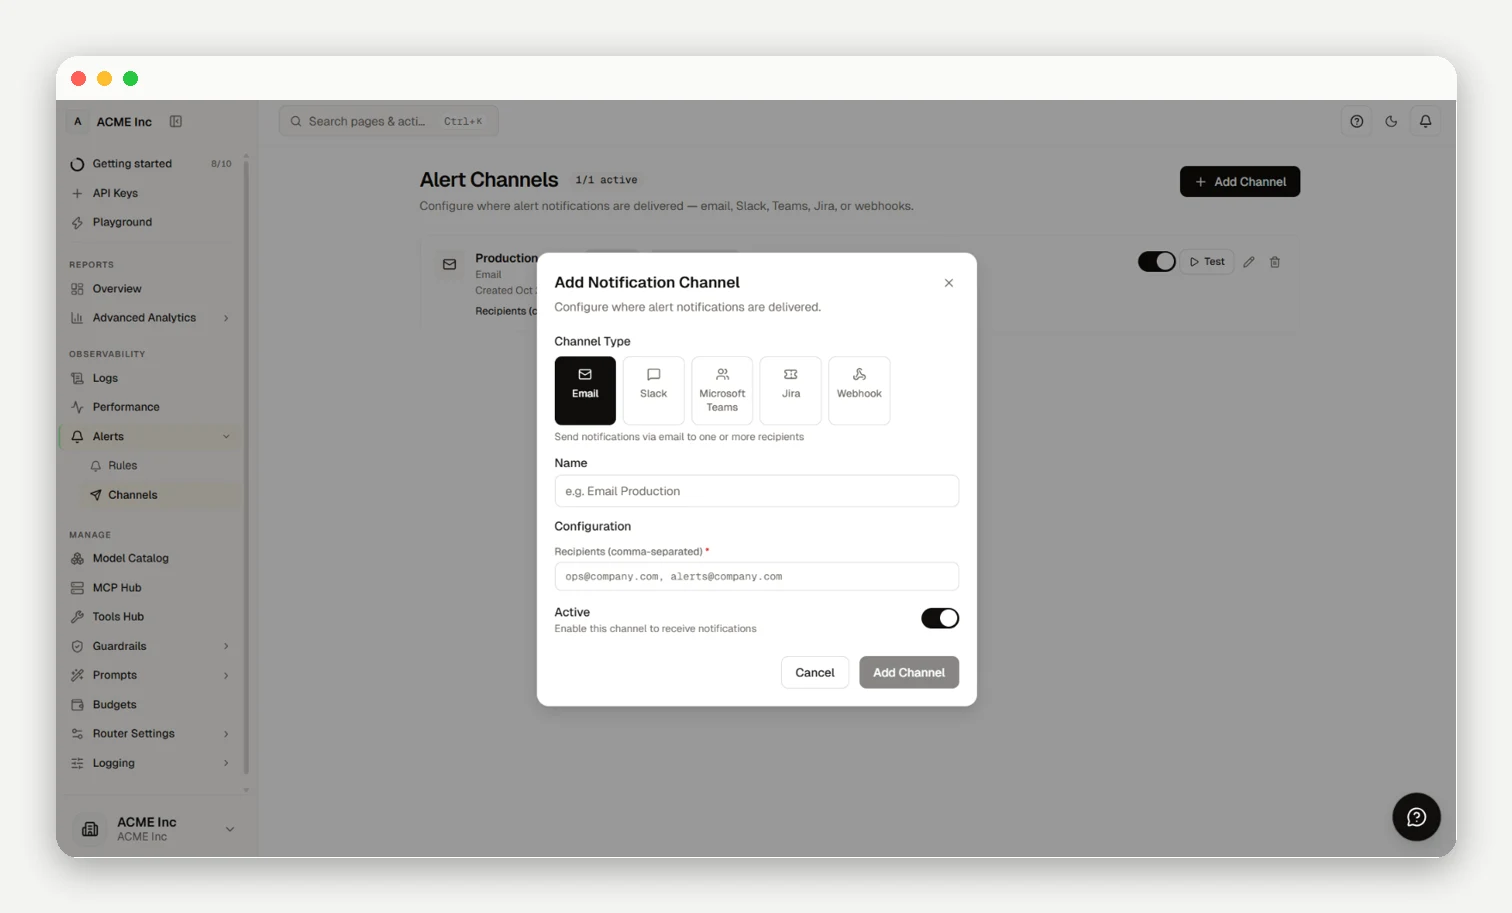
Configure destinations under Alert Channels (see Observability & Logs). Toggle rules on /alerts to pause notifications.
Next steps
- Observability & Logs — Define the channels alerts deliver to
- Budget Controls — Set the budgets that Budget Alerts watch
- Analytics & Reports — Investigate what triggered an alert
Frequently asked questions
Who can create or change alerts?
Only Owners and Org Admins can configure alerts; Members and Viewers have read-only access.
Which alerts can I actually turn on today?
All alerts except Region Outage (which is in preview and marked Not monitored yet) are actively evaluated and delivered.
I can see the threshold being exceeded in my logs, so why no alert?
Check the 20-request floor for aggregate rules, confirm a channel is bound, and verify cooldowns or the 30-second settle margin have passed.
How quickly will I hear about a problem?
Telemetry alerts evaluate every 5 minutes and budget alerts every 10 minutes, plus the 30-second settle margin.
Why did I only get one email when the problem lasted an hour?
Alerts enforce a 15-minute cooldown (24 hours for budget alerts) to prevent notification storms.
How do Daily Reports arrive, and can I change the recipients?
Daily digests are automatically emailed to current Owners and Org Admins based on active membership.
Do alerts stop or throttle my requests?
No, alerts notify only without altering traffic; hard stops are enforced by Budget Controls.
What notification channels can I use?
Email, Slack, Microsoft Teams, Jira, and generic Webhooks configured under Observability & Logs.
Do alerts consume my credits or count against my rate limits?
No, alerts are background notifications that consume zero credits and do not count toward rate limits.
Is there a history log of alerts that fired?
No, the dashboard displays active rules only; inspect past incidents via request logs and Analytics & Reports.