


Analytics & Reports
Analyze LLM spend, token volume, model latency, and error trends with nRouter advanced analytics. Generate team-level reports to optimize inference costs.
nRouter Advanced Analytics turns historical gateway telemetry into granular spend, token usage, and latency intelligence. Every report shares a unified control bar — select a time window, aggregate by dimension (model, provider, key, team, or attribution tag), and filter to isolate high-impact traffic. For per-end-user attribution, use the API Consumers report.
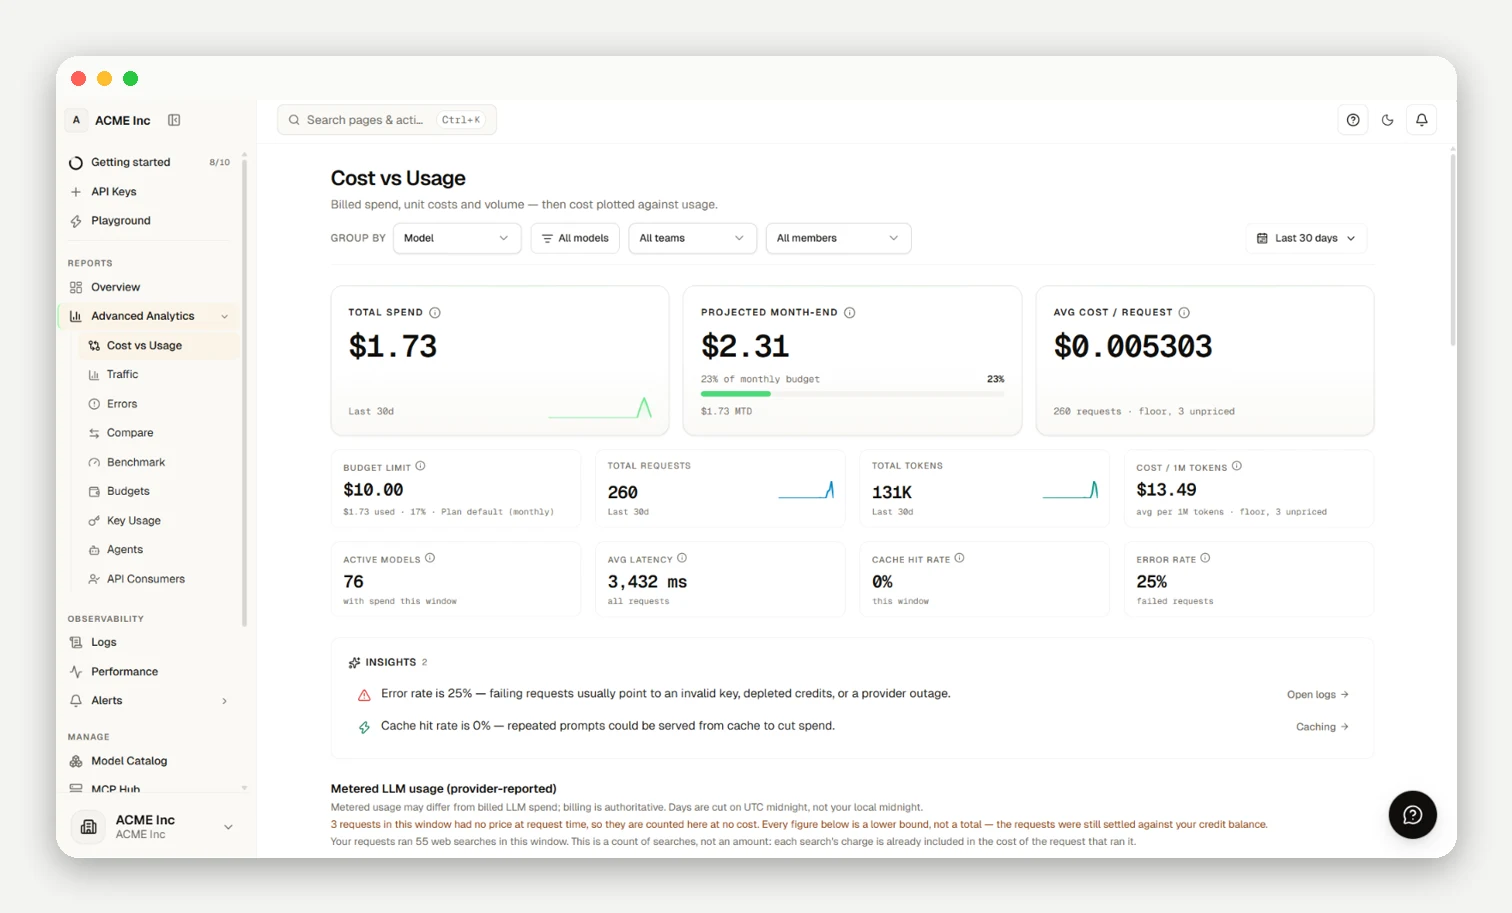
Reports Overview
| Report | Path | Purpose |
|---|---|---|
| Explore | /advanced-analytics/explore | Combined cost, usage, and budget overview |
| Cost | /advanced-analytics/cost | Spend by model, key, or tag over time |
| Usage | /advanced-analytics/usage | Request volume and token splits |
| Cost vs Usage | /advanced-analytics/cost-vs-usage | Cost per request and per 1k tokens |
| Budgets | /advanced-analytics/budgets | Burn-down against caps (manage in Budget Controls) |
| Key Usage | /advanced-analytics/keys | Per-key spend, tokens, cache rates, and latency |
| Agents | /advanced-analytics/agents | Spend attributed to agent:<id> tags |
| API Consumers | /advanced-analytics/api-consumers | Spend attributed to end-user identities |
| Compare | /advanced-analytics/compare | Period-over-period trend comparisons |
| Benchmark | /advanced-analytics/benchmark | Side-by-side cost, latency, throughput, and error rates |
Controls & Metrics
- Filters: Presets from 24h to 1 year (
24h,7d,30d,90d,1y) or custom windows. Group by model, provider, key, team, or tag. - Exports: Aggregated CSV downloads available for Owner and Admin roles.
- Invariants: Tool charges (agents/MCP) are isolated from token metrics; Budgets displays peak burn rather than double-counted sums; full latency percentiles (p50–p99) live at
/performance.
Next steps
Frequently asked questions
Who on my team can view these reports and export the data?
All members can view analytics (scoped to their own keys or full org based on role), while CSV export requires Owner or Admin roles.
Does viewing analytics cost me credits or count against my rate limits?
No, analytics queries are read-only historical rollups that never consume credits or rate-limit slots.
Why doesn't the spend in Analytics exactly match my budget enforcement or invoice?
Spend charts visualize observability logs, while budget enforcement relies strictly on the authoritative credit ledger.
How do I break my spend down by model, key, team, or tag?
Use the Group by control to pivot charts by dimension, or click bars in the top-5 list to filter instantly.
Can I attribute cost to specific agents or individual end-users?
Yes, attribute spend via agent:<id> tags in the Agents report or via the user field in API Consumers.
How far back can I look, and are there any limits on long time windows?
Windows range from 24h to 1 year, with latency columns in Benchmark capped at 90 days on 6mo/1y views.
Are nRouter tool and agent (MCP) charges mixed into my LLM spend numbers?
No, tool charges are separated on Cost and excluded from Cost vs Usage to prevent distorting per-token ratios.
How do I tell which model is cheapest, fastest, or most reliable for my traffic?
The Benchmark report ranks models side-by-side across cost, p95 latency, throughput, and error rates.
Can I compare this period against the previous one or last year?
Yes, the Compare report overlays your active window against prior periods to highlight trend deltas.
Where do I set the budgets these reports track against, or drill into a single request?
Configure caps in Budget Controls and drill into individual request traces in Observability & Logs.